2022-10-20 『やっぱり、Gunplotは凄いなぁ』と久々に感動してしまいました。 [長年日記]
私は、数式を『数式のまま理解する能力』がありません。
I do not have the ability to 'understand formulas as they are'.
基本的には、その数式に数値を当てはめて、数字や図形にして、やっと『理解したような気になる』ことができます。
Basically, I can finally 'feel like I understand' by applying numerical values to those formulas and turning them into numbers and figures.
いや・・・正確に言うと、「図形」でもダメですね ―― 自分の身の回りに関する数値に落し込んで、ようやく分かったような気になります。
No... to be precise, not even "figures" -- I feel like I finally understand it when I drop it into figures related to my immediate surroundings.
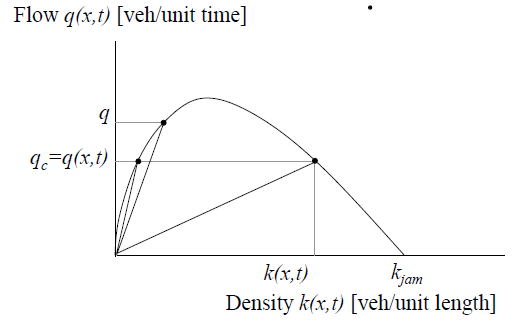
上記のモデルの具体例を求めて、昨夜、YouTubeでインドの大学の講義を聞いて、具体的な数値をパクって、エクセルに落し込んでみました。
In search of a concrete example of the above model, I listened to a lecture at an Indian university on YouTube last night, took down the specific numbers, and dropped them into Excel.
グラフが出てきたの見て、ようやくホッとしました。
I was finally relieved when I saw the graphs.
-----
あるいは、
Or, about the following formula,
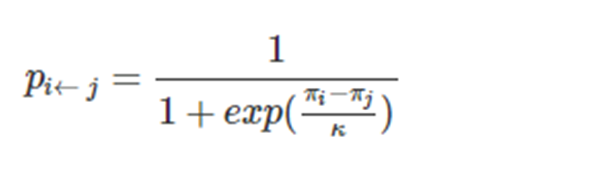
なども、訳が分からずにプログラムに組み込むと、後で酷い目になるので、とりあえずイメージを掴んでおきたいと思っていました。
I wanted to get an idea of what it would be like to incorporate mathematical formulas into a program without understanding them, because it would be terrible later on.
ただ、この式は入力変数が2つになるので、3次元表示をさせなければなりませんが、エクセルは3次元表示のバラエティが十分にありません。
However, since this formula has two input variables, it must be displayed in three dimensions, but Excel does not have enough variety in the three-dimensional display.
I was wondering what to do and then I remembered "Gnuplot".
数年振りに動かしてみたところ、数式1行(事前設定ゼロ)で、この図が出てきました。
I ran it for the first time in several years and got this figure with one equation line (zero preconfiguration).
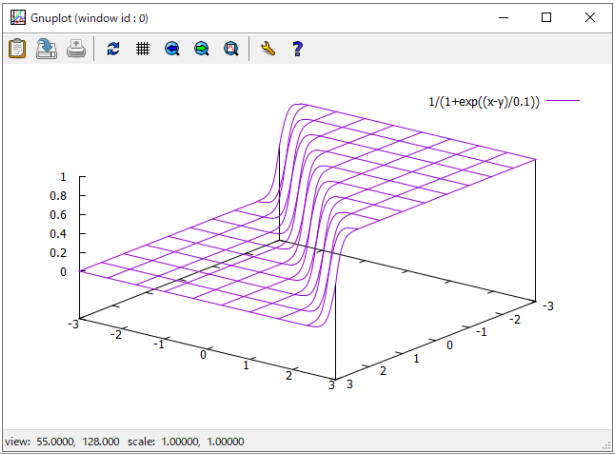
『やっぱり、Gunplotは凄いなぁ』と久々に感動してしまいました。
I was moved again with saying "Gunplot is great"