2022-10-20 I was moved again with saying "Gunplot is great" [長年日記]
I do not have the ability to 'understand formulas as they are'.
Basically, I can finally 'feel like I understand' by applying numerical values to those formulas and turning them into numbers and figures.
No... to be precise, not even "figures" -- I feel like I finally understand it when I drop it into figures related to my immediate surroundings.
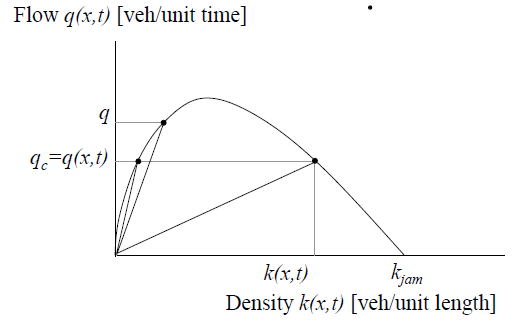
In search of a concrete example of the above model, I listened to a lecture at an Indian university on YouTube last night, took down the specific numbers, and dropped them into Excel.
I was finally relieved when I saw the graphs.
-----
Or, about the following formula,
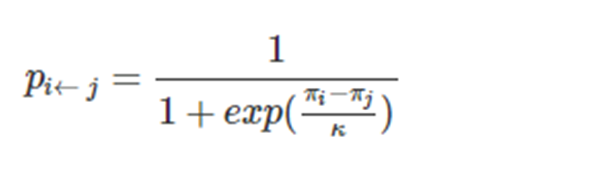
I wanted to get an idea of what it would be like to incorporate mathematical formulas into a program without understanding them, because it would be terrible later on.
However, since this formula has two input variables, it must be displayed in three dimensions, but Excel does not have enough variety in the three-dimensional display.
I was wondering what to do and then I remembered "Gnuplot".
I ran it for the first time in several years and got this figure with one equation line (zero preconfiguration).
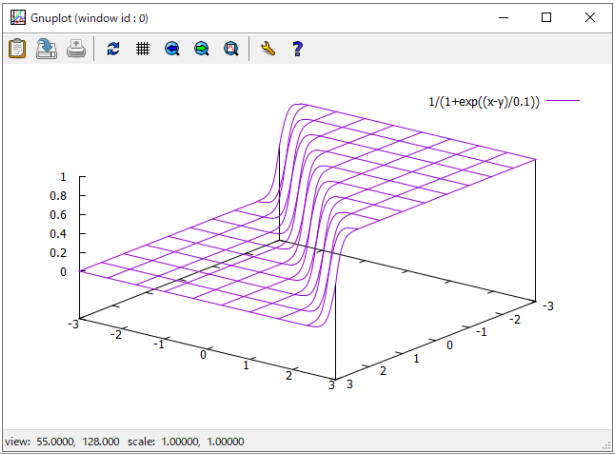
I was moved again with saying "Gunplot is great"